
introduction
Modelling impact in a venture capital portfolio requires a new approach. Climate impact does not behave like a financial return and the difference changes how a portfolio is built, how write-offs are managed, and how impact-linked carry is designed.
Written by Carbon13’s CEO Dr Nicky Dee, Nicky’s thinking for the J Curve started when she realised that most investors present a single number: tonnes of carbon dioxide equivalent avoided, or projected to be avoided, across the portfolio. While this is a reassuring figure and a great target. Similarly, there is often a target for financial returns. In the venture space it takes time for ventures to mature before achieving these targets. And what start to bother her? When would climatetech ventures reach their targets? What does that mean for their portfolio performance? And it was answering this question that led her down a rabbit hole. Admittedly one she started a few years ago when she was playing around with market penetration and technology adoption curves.

The question is never simply “how much impact” but “how much impact and by when?” A model that cannot answer the second question is not really answering the first.
Why net impact starts below zero
Building the battery factory
Building a battery factory has an embodied carbon cost, and manufacturing is inefficient at first, before learning curves take hold.
Making the solar panel
A solar panel needs physical infrastructure with embodied carbon, even if its use phase is predominantly net zero.
R&D on a decarbonising grid
Running research and development on an electricity grid that is itself still decarbonising should be factored in.
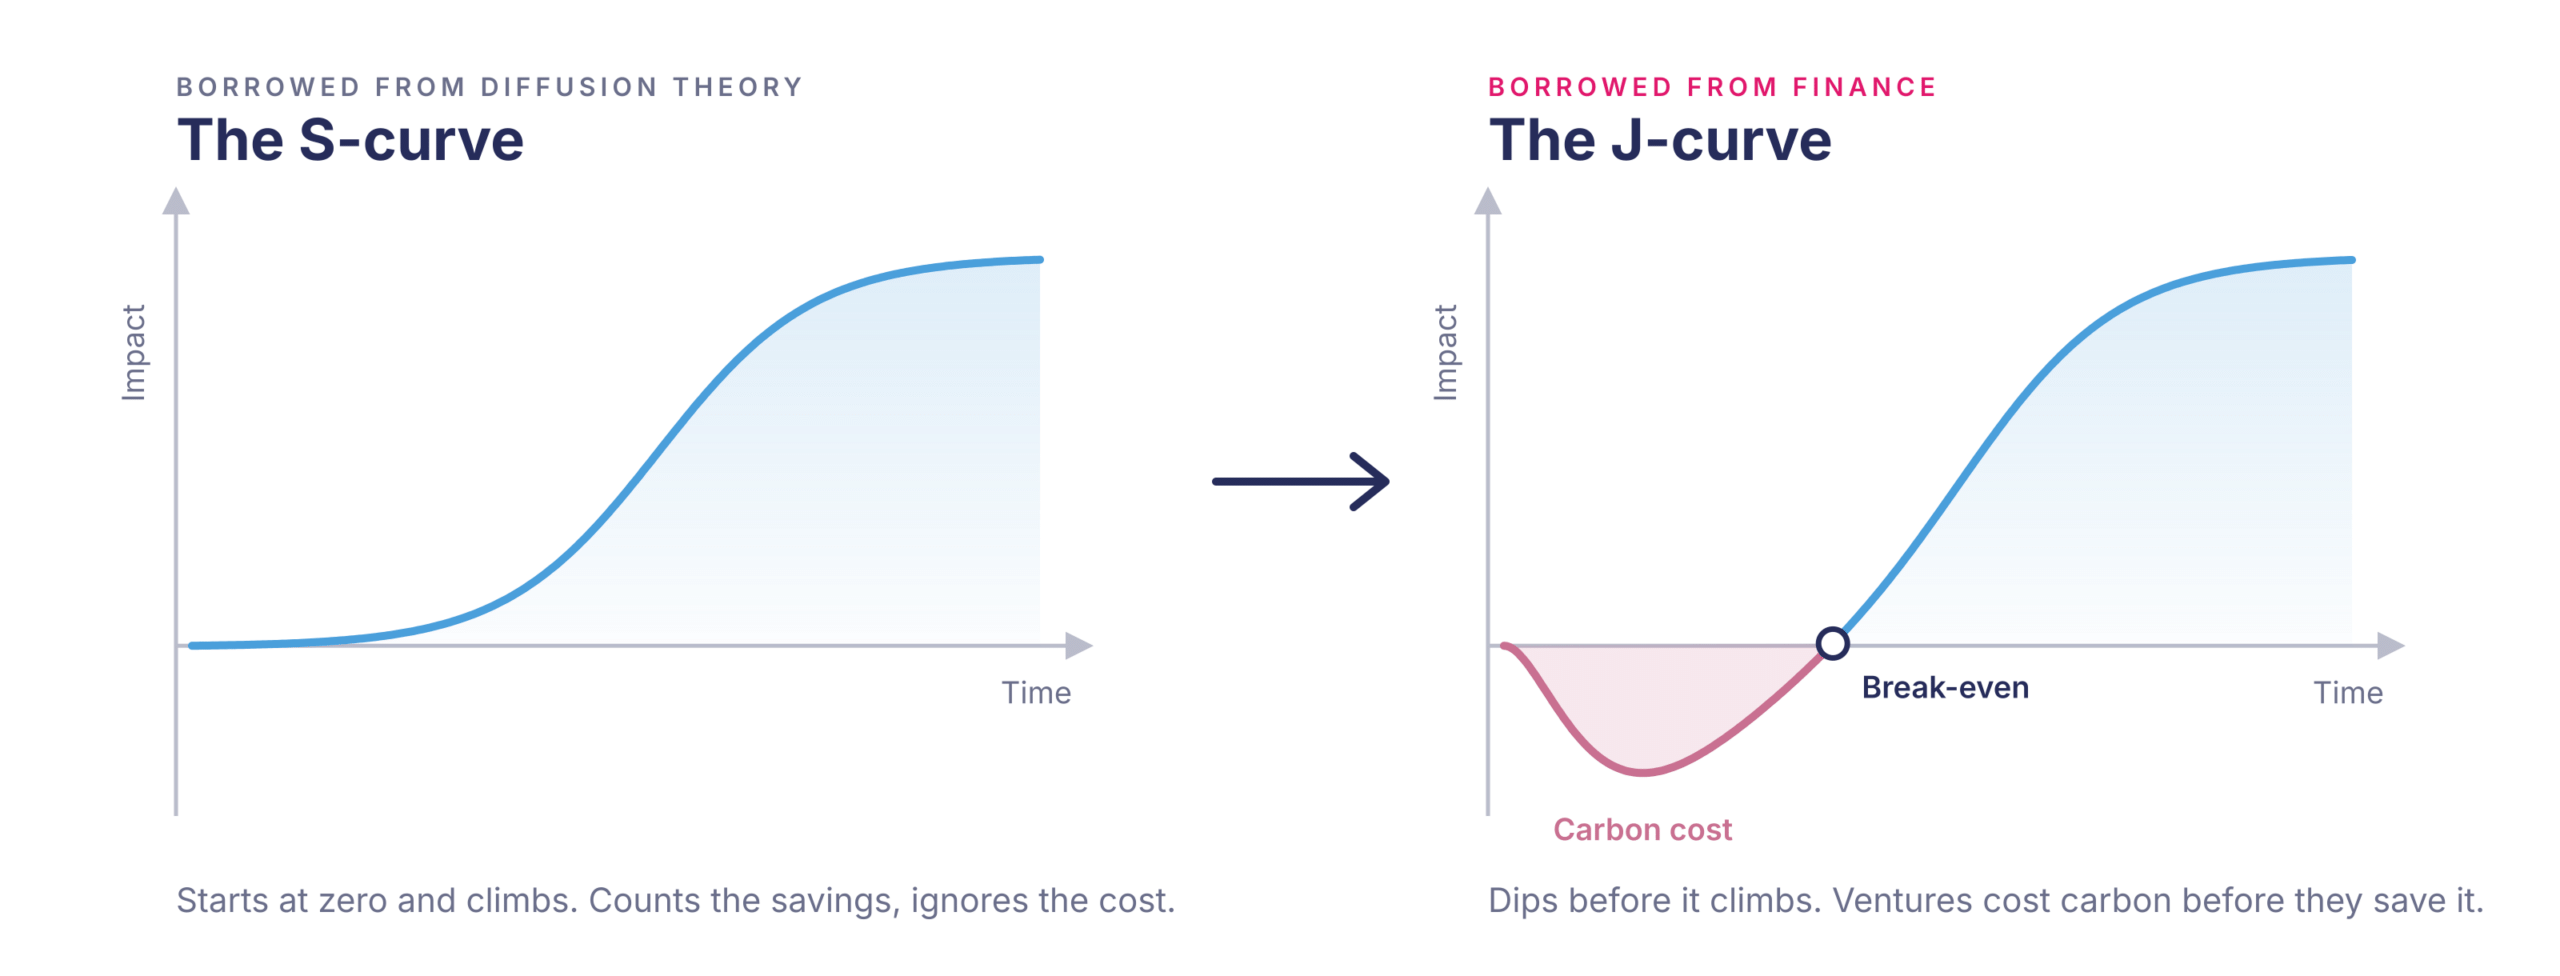
A company’s climate benefit accrues gradually as its technology is deployed and displaces the fossil incumbent. The cost leads and the benefit lags. Net impact therefore does not begin at zero and climb. It begins below zero.
From the S-Curve to the J-Curve
Investors will recognise the shape immediately because they already evaluate J-curves when exploring early-stage ventures and fund performance. Negative P&L is exactly the reason why equity investment is used rather than debt finance when a venture is building. And funds initially underperform while they incur write-offs and wait for their unicorns to emerge. During this stage there may be little or no revenue but there is anticipation of future growth and scalability. Climate impact has exactly the same shape. And yet the impact-investing industry, which borrowed the S- curve from diffusion theory, has not yet borrowed the J-curve from its own finance department.
Applying this to Carbon13
We can apply the assumptions above to the Carbon13 portfolio, assuming the current level of venture creation and support continues at the current pace until 2035. The shape of portfolio performance will likely hold even if the quantum of impact in different categories needs adjusting as we get better information going forward.
Aggregated across a portfolio, ours is currently around 60 per cent hardware and 40 per cent software, so we combine the individual J-curves into a portfolio J-curve. We include standard assumptions on the likely performance and survival rates of the portfolio over time.
On our central assumptions:
- Portfolio mix: around 60% hardware, 40% software
- Activity assumed: 288 investments across 9 cohorts to 2035, plus historical activity
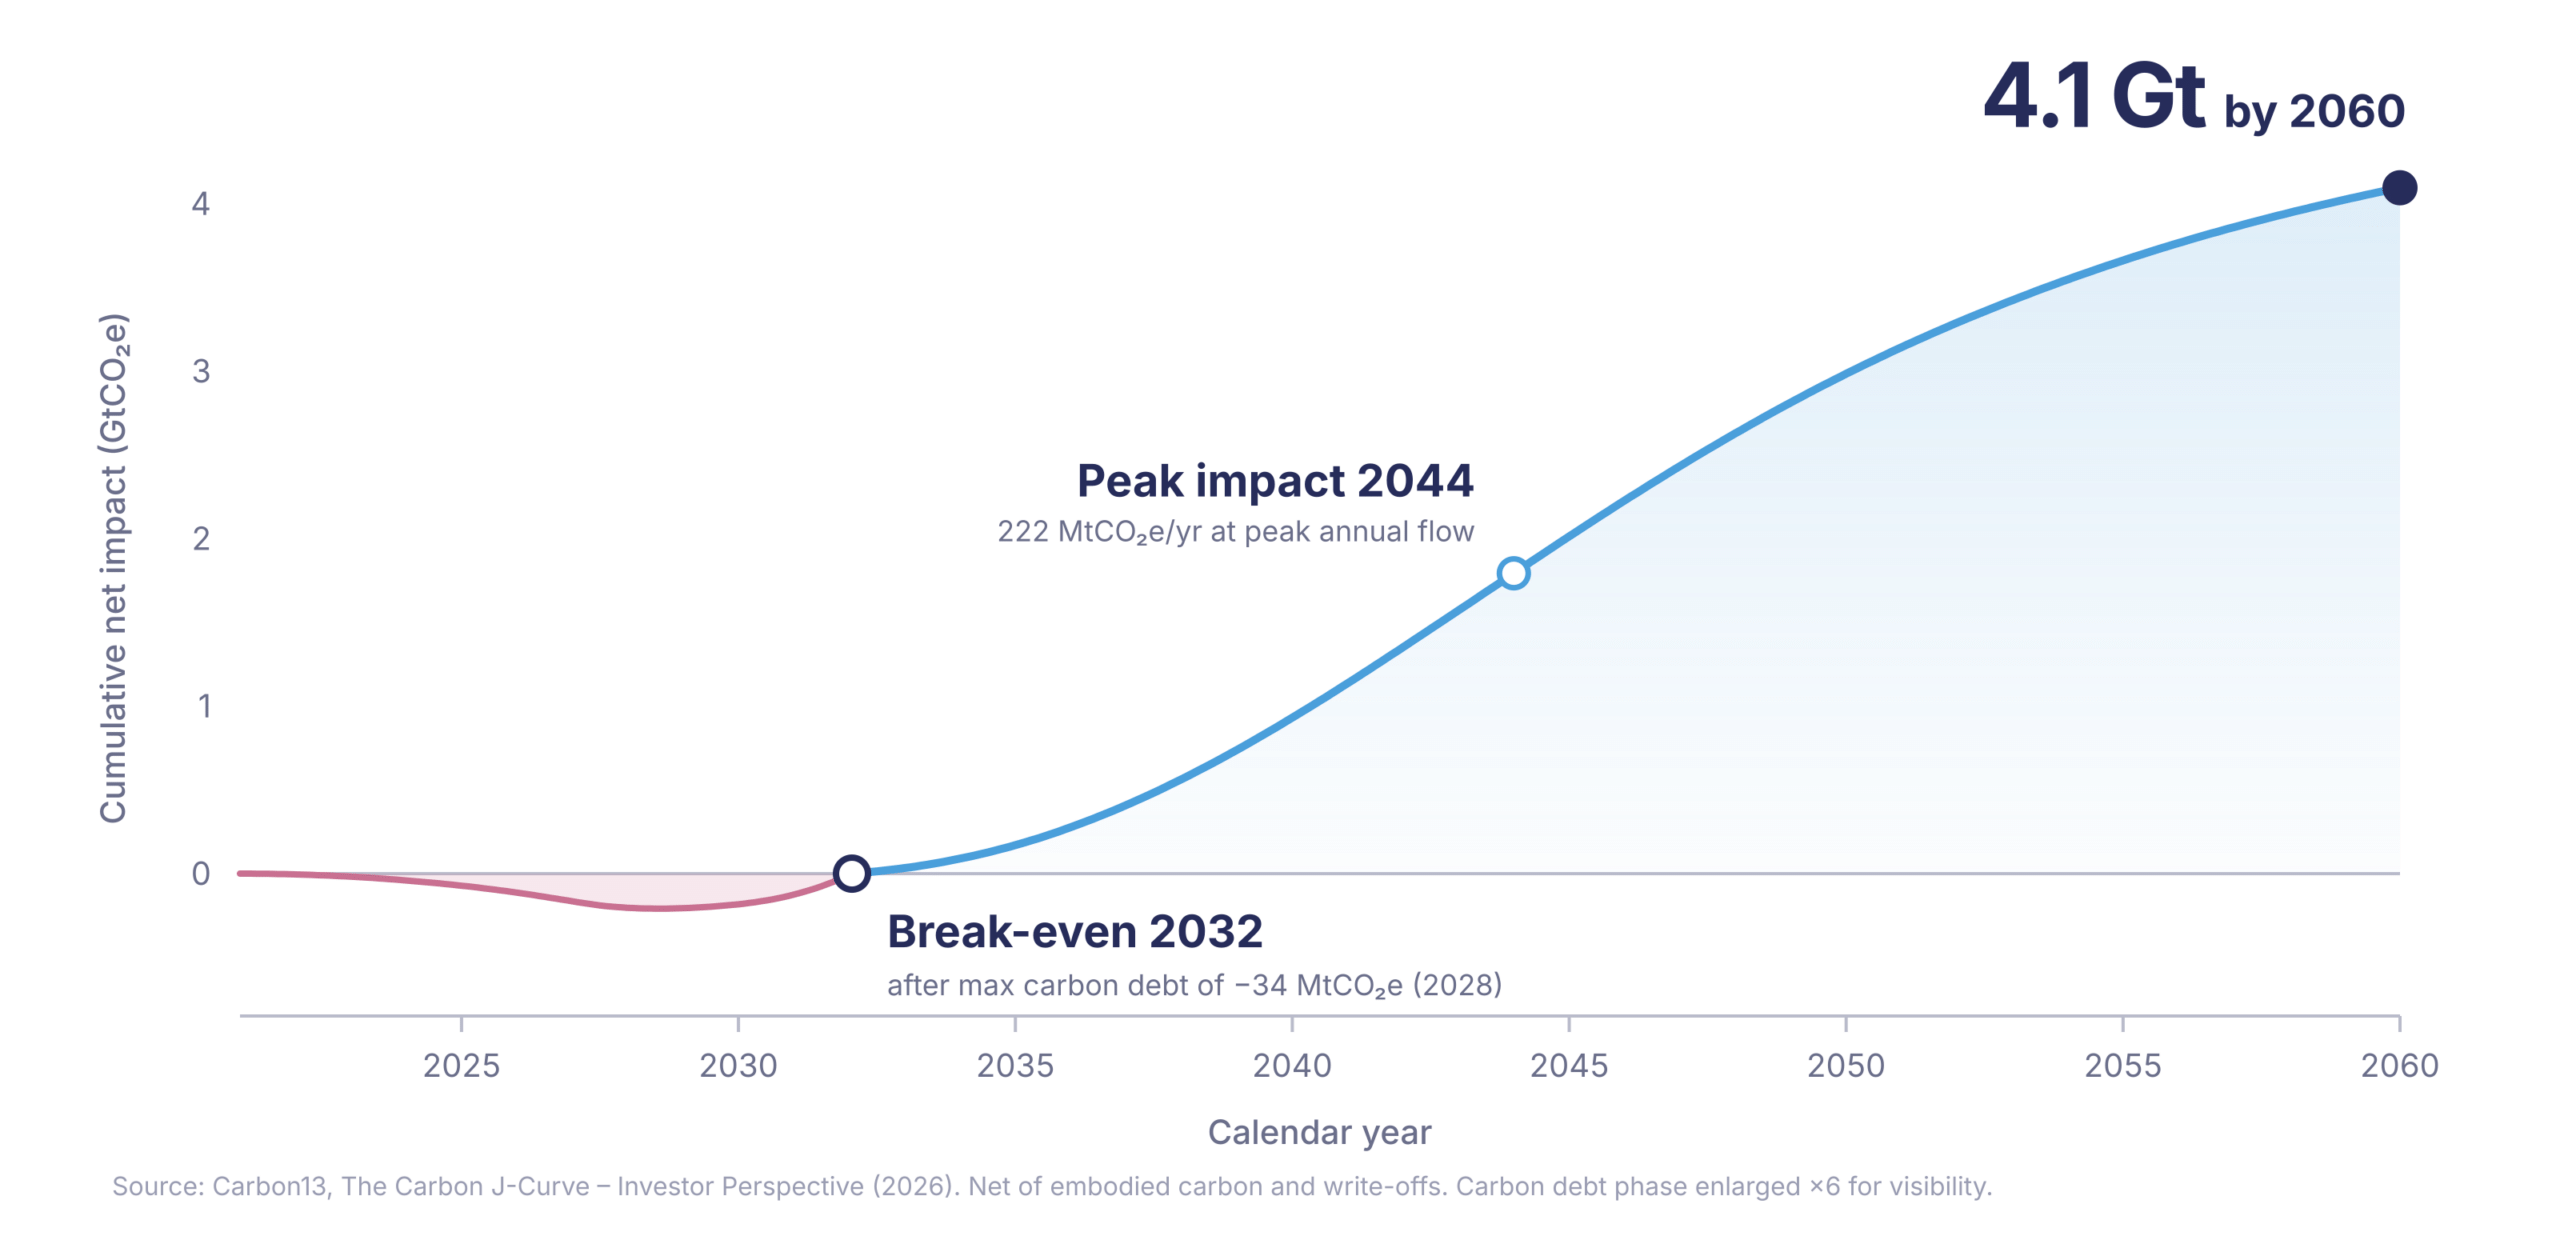
- Maximum carbon debt: roughly 34 MtCO₂e in 2028
- Carbon break-even year: 2032
- Embodied carbon: netting it out removes under 10% of the gross figure over the full horizon
The portfolio carries a net carbon debt in its early years before crossing into genuinely net-positive territory in 2032 (Figure 7). That crossing point has a name worth adopting: the portfolio carbon break-even year.
READ THE REPORT
Understand more of the theory behind the Carbon J-Curve, the nuances of how it develops across software and hardware solutions, and how the curve could change with the development of AI, by reading the full report.
